




HOFA Analyzer V3 Presale
159,00 € Original price was: 159,00 €.99,00 €Current price is: 99,00 €. incl. VAT
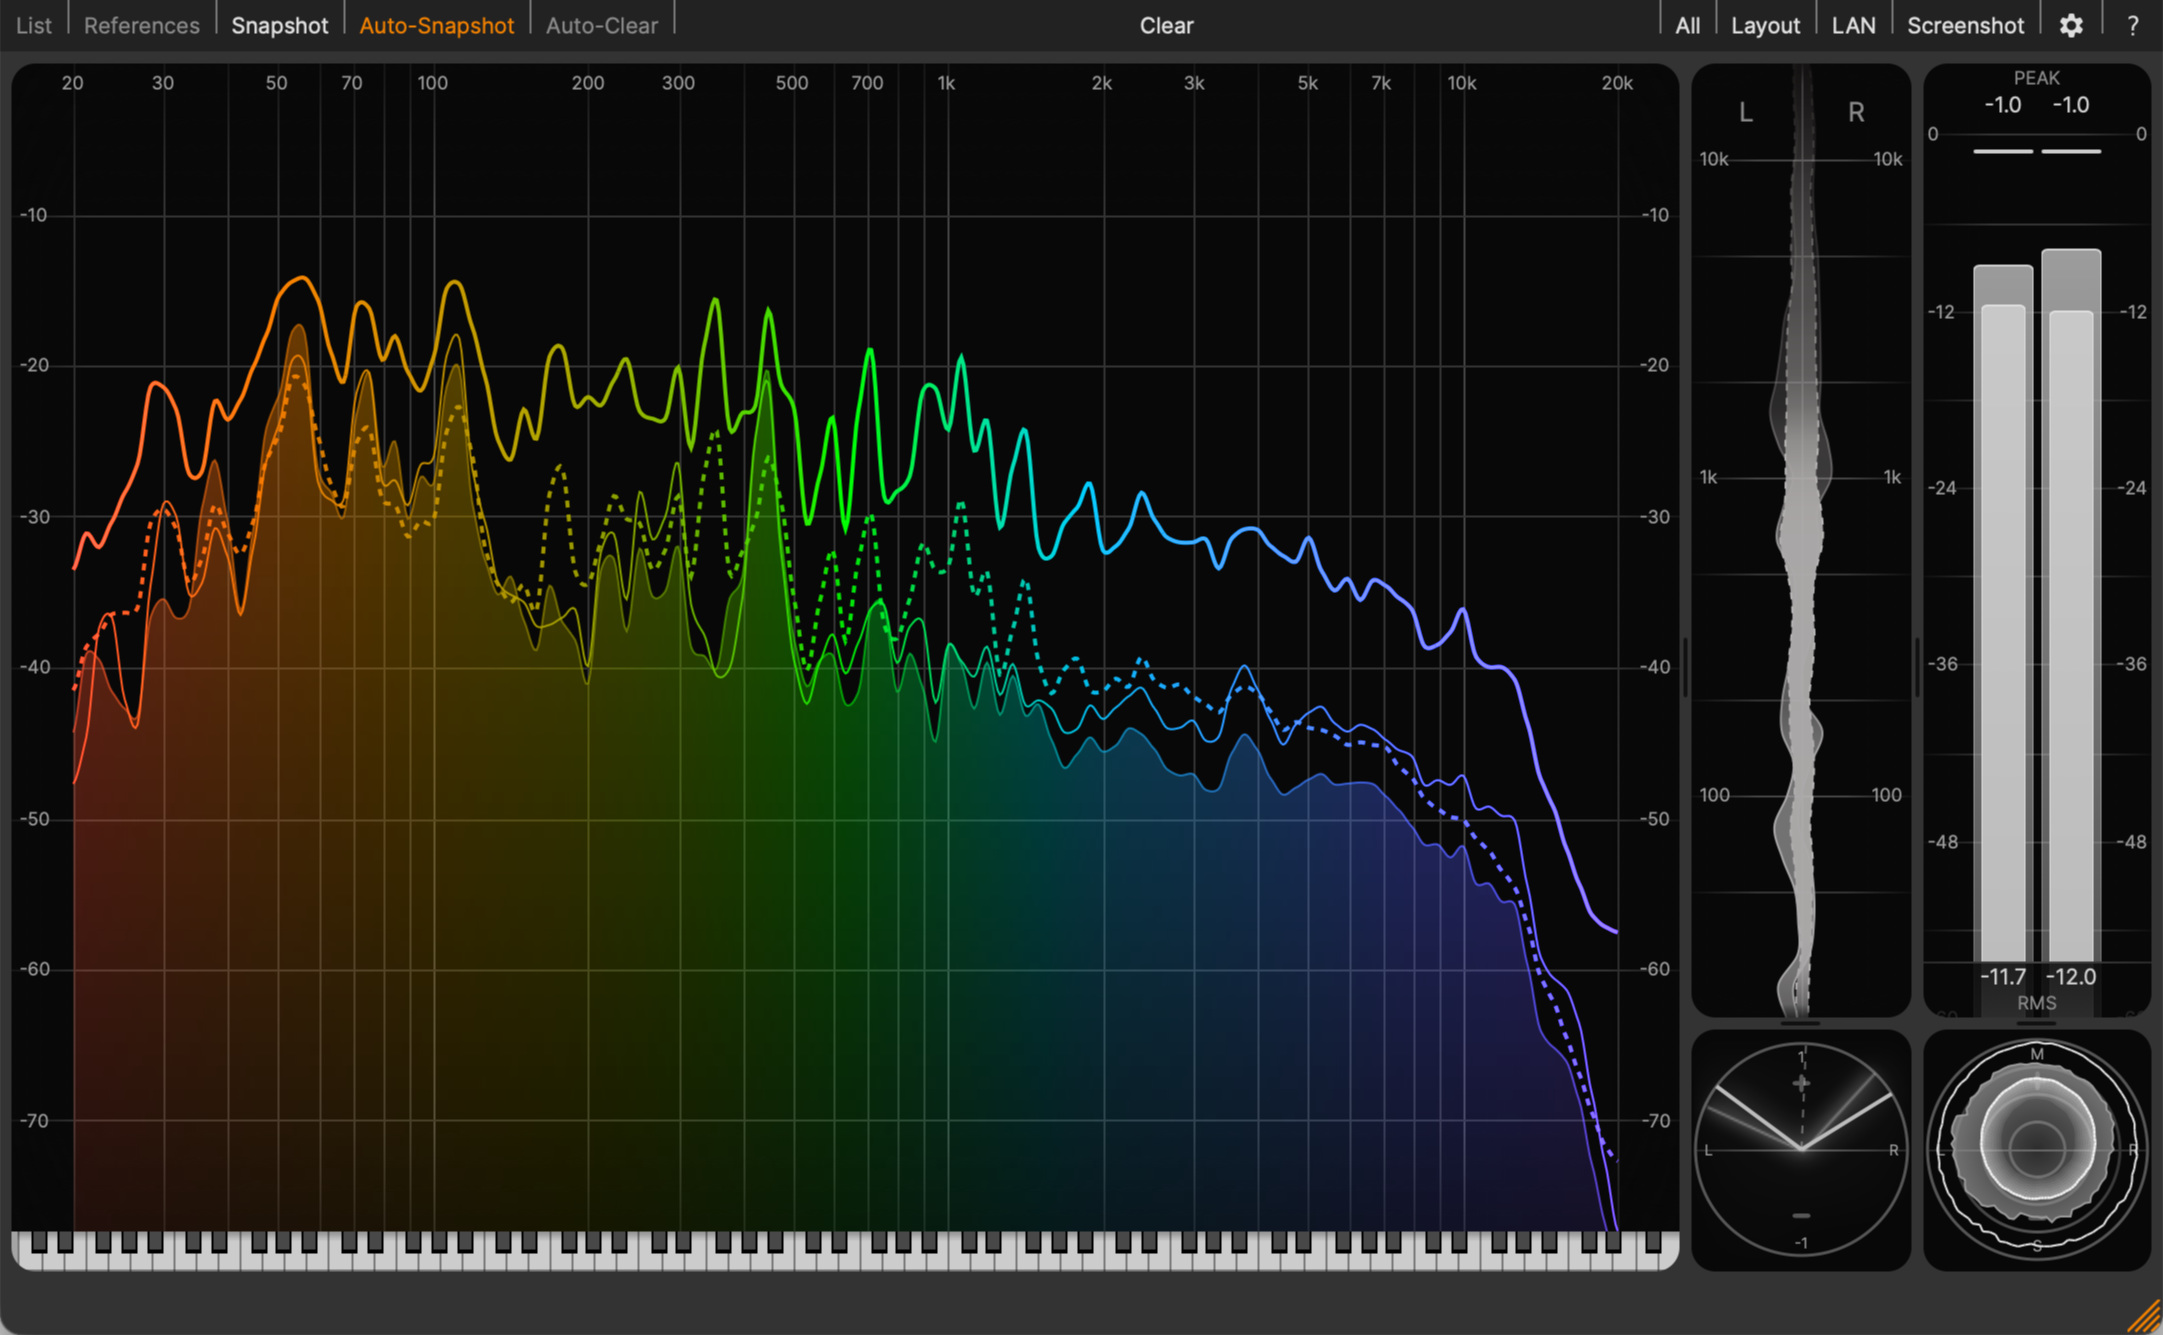
With a single glance at the HOFA Analyzer V3, you’ll instantly see what your productions need: Ultra-high-resolution and precise measurements reveal every detail. Configure the layout freely to match your workflow. Work fast and focused by comparing your mixes against included reference curves, or curves you’ve created yourself.
- Precise frequency analyzer for studio & live use (VST3, AU, AAX & standalone)
- Innovative correlation meter for quickly checking stereo width per third-octave band
- Comprehensive metering (Peak, Hold, EBU, LRA, RMS, Goniometer)
- Build your own custom metering layout
- References for a wide range of instruments & music genres
% Presale Deals HOFA Analyzer V3 %
Full version now only €99 (later €159)
You’ll receive the IQ-Series Analyser V2 (plugin & standalone version) immediately and the new HOFA Analyzer V3 in fall 2026.
Upgrade now for only €49
Already own IQ-Series Analyser V1 or V2?
Check out your upgrade offer in your customer account now ›
Why You Need the Energy Curve
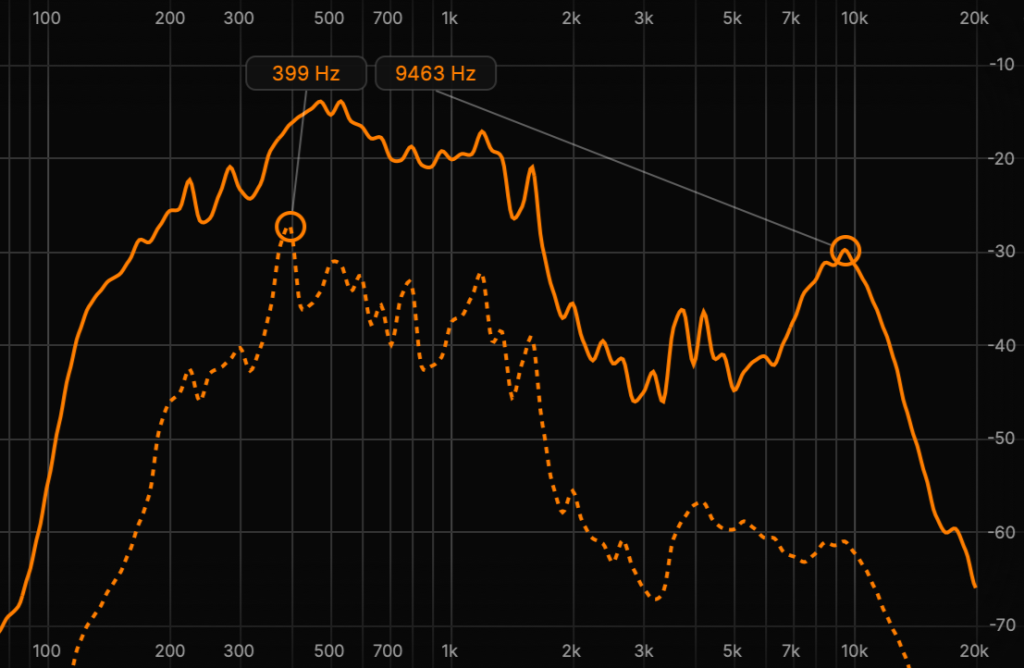
The dashed Energy curve in the HOFA Analyzer shows where the most energy is concentrated in your track over the entire measurement period. This makes it an innovative tool for targeted mix decisions: With minimal EQ adjustments, you can process exactly the frequency ranges that truly shape the sound.
Essential: the Hold Curve
The solid Hold curve serves a different purpose—it captures the highest level reached at each frequency, making short peaks visible that would be lost in the Energy curve.
Energy and Hold: The Perfect Pair
One shows the average tonal character, the other shows short-term extremes—together they provide a complete picture for precise mixing.
What These Curves Are Telling You
Above, you can see a screenshot of the Analyzer on a vocal track. If the sound feels too muddy in the low-mids, cut around 399 Hz with an EQ, since that’s where the Energy curve shows a peak.
You’ll most likely want to tame around 9463 Hz with a dynamic EQ or DeEsser – that’s your sibilance, and since it only occurs briefly, it only shows up in the Hold curve.
For extra brightness, a shelf filter starting around 2 kHz works well.
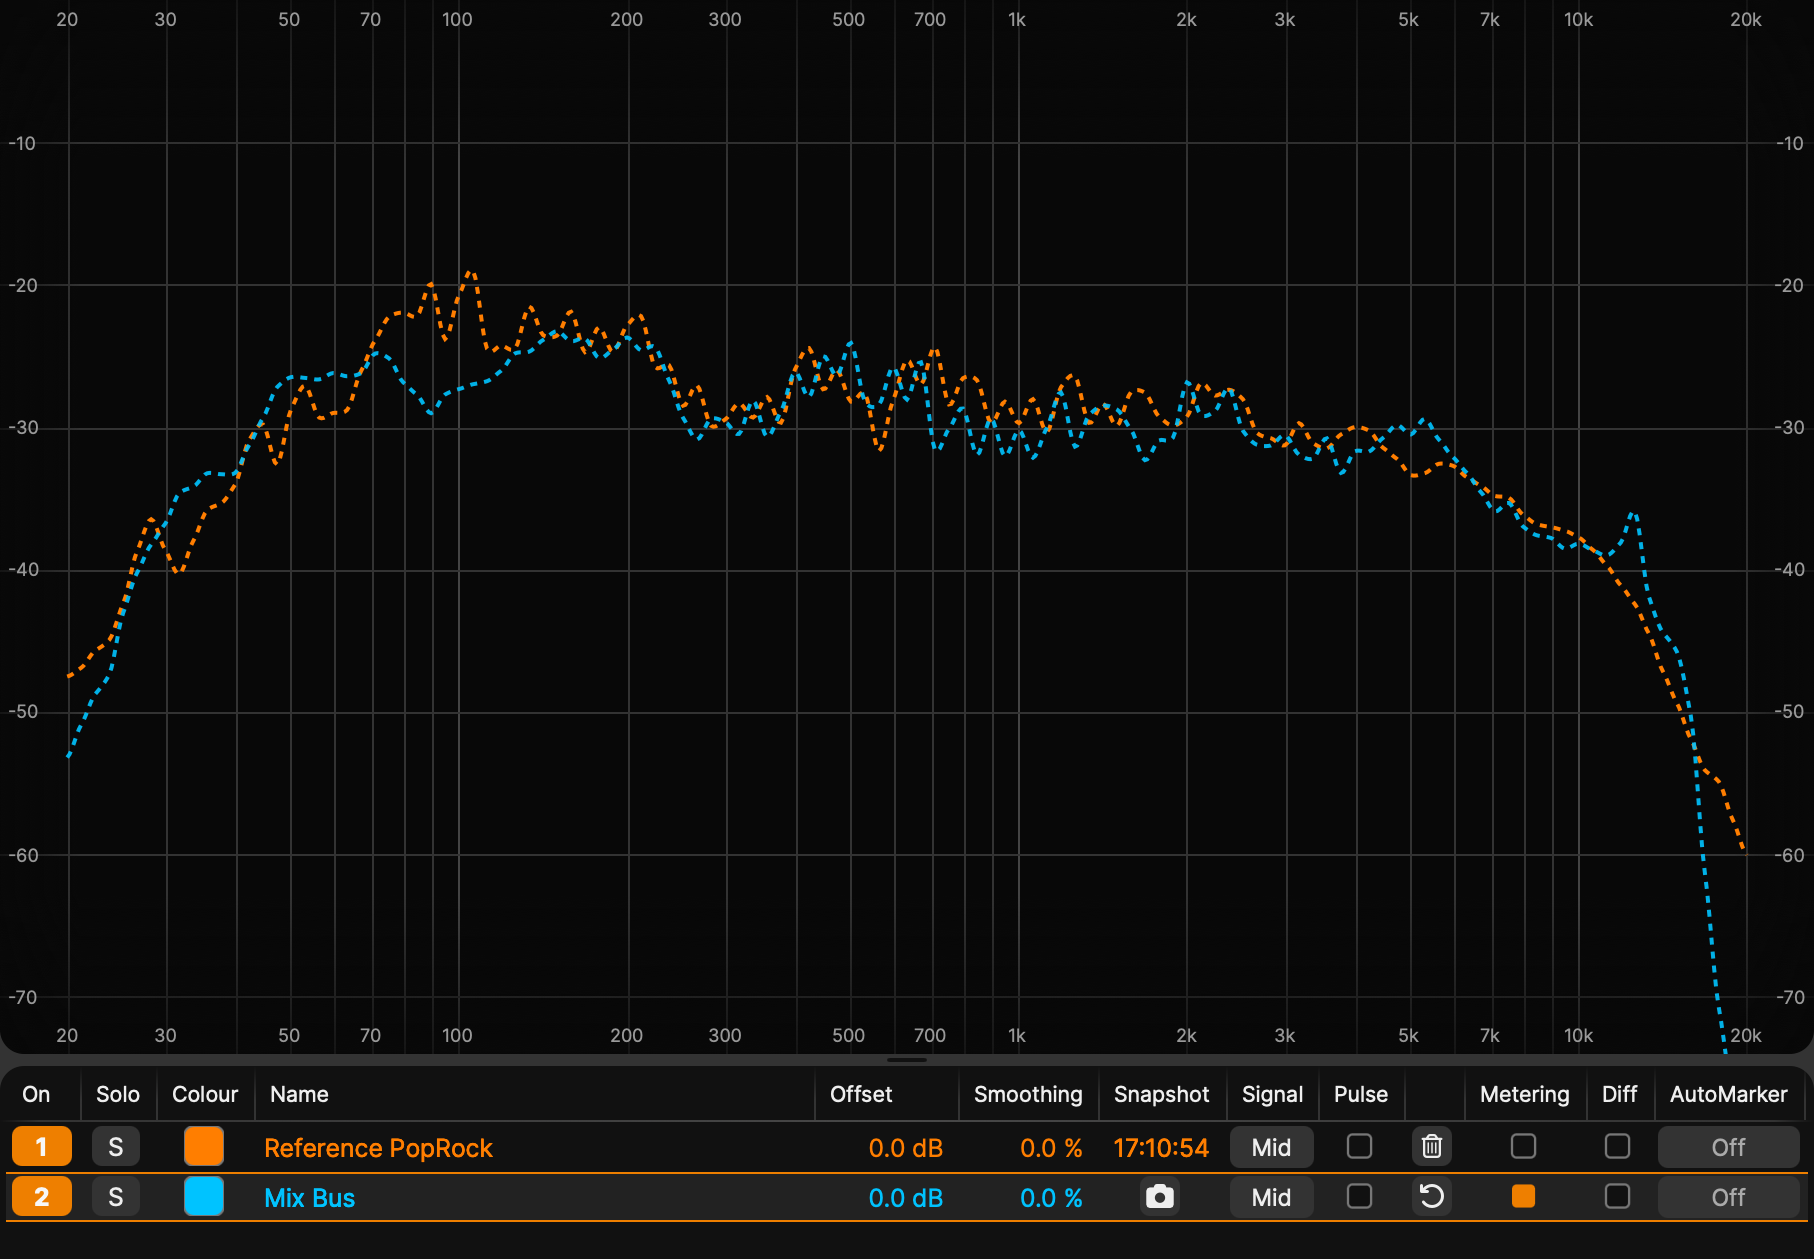
In the range from 70 to 150 Hz
this reference has significantly
more energy. So you should
check the relevant frequencies
and levels in, for example,
the kick, bass, or
guitars.
If your mix sounds too
aggressive compared to the
reference, the problem is in
the frequency range around 5 kHz—
there's significantly more energy
here than in the reference.
Process the instruments
causing this peak.
This noticeable peak probably
comes from a tambourine or
similar. If it bothers you,
you can fix it with EQ
or level.
Mix and master better with reference curves
It’s simple:
- Load the Analyzer V3 on the mix bus and look at the Energy curve—in this screenshot it’s blue.
- Select a reference curve from the included extensive library that stylistically matches your production. In our example above, that’s the “PopRock” reference (orange).
- Compare these curves with each other. The interesting areas are the frequency ranges where the two have a larger distance from each other. We’ve marked these points in the screenshot.
- Now you can boost or cut the instruments sounding in these frequency ranges and find solutions with the EQ.
This method isn’t about matching the curves exactly, but recognizing the relevant differences between the reference and your production. Often there are different ways to minimize the differences. Choose the solution that sounds most organic.
Why Filterbank Technology?
The HOFA Analyzer V3 uses proprietary filter bank technology — now with the new V3 generation in double the resolution. Instead of splitting the spectrum into rigid, equally wide bands, the filter bank divides the frequencies logarithmically: with finer, tighter bands in the musically crucial bass and midrange — right where mix and mastering decisions are made.
The advantages of filterbank technology:
- High frequency accuracy in the low end
- Now fully GPU-accelerated – maximum resolution with lower CPU load
- No compromise between time and frequency resolution
- Zero latency – works without the lag inherent in FFT windows
- Aurally correct logarithmic scaling
Classic FFT analyzers work differently: they split the spectrum linearly – every band is the same width, whether at 50 Hz or 15,000 Hz. However, the human ear hears logarithmically: the distance between 50 and 100 Hz feels just as large as between 5,000 and 10,000 Hz. Furthermore, FFT forces a fixed compromise between time and frequency resolution across the entire spectrum – if you want more frequency resolution, you lose temporal precision, and vice versa. Especially in the low end, where a few Hertz can make the difference between a clean or muddy mix, FFT quickly reaches its limits.
Frequency Correlator
A classic correlation meter only shows you a single value for the entire mix: How mono-compatible, or how “stereo-safe,” is your signal overall? But real mixes are rarely equally wide across the entire frequency spectrum—the bass is often narrower than the highs, some instruments sit in the center, others wide in the panorama. This is exactly where the frequency correlator in HOFA Analyzer V3 comes in:
It shows you the stereo width not as a single overall value, but broken down by frequency range.
The axes are easy to read: Frequency runs from bottom to top, left and right indicate the panorama. The wider the curve peaks at a given point, the wider your stereo image is there.
You’ll see two curves: the solid line responds very quickly and shows the current moment. The dashed line is a time-averaged curve—it shows the trend over a longer period and filters out short spikes, just like the Energy curve in the Frequency Analyzer.
It’s especially important to keep an eye on the low end. If the curve becomes wide and colored red there, it means: Your bass is heavily distributed across the stereo field instead of sitting centered. This can become a problem as soon as the song is played on a mono system—such as a Bluetooth speaker, on the radio, or in some clubs. There, the left and right bass signals can cancel each other out, the bass loses punch and power, or sounds thin.
Therefore, as a rule: keep bass centered and narrow – look for width above 100 Hz instead. With the frequency correlator, you can identify problem areas immediately and take countermeasures, for example with a mono maker or by reducing stereo effects like chorus or reverb in the low end.
HOFA Analyzer V3 Upgrade Highlights
- New Complete GPU processing – drastically lower CPU load, noticeable even in offline analyses
- New Hardware-accelerated graphics – smooth display even with many overlaid curves
- Improved Completely redesigned, modern GUI
- New Custom layout mode – arrange measurement tools completely freely, including presets for complete layouts
- Improved Double filter bank resolution – even more precise analysis
- New Multi-channel/surround support
- Plugin & standalone included with purchase
Analysis & Frequency Spectrum
- Analyzer with peak, hold, RMS, and energy functions
- Improved High-resolution frequency spectrum analysis
- Improved Absolute precision in the bass range thanks to filter bank technology
- Stepless frequency zoom
- Improved Continuously adjustable display resolution
- New Display of when frequency peaks were triggered
- Improved General performance improvements
- Automatic marking of peaks and dips
- Sine tone playable from analyzer keyboard
- Adjustable pink noise/white noise weighting
- Selectable input signal (mid, side, left, right)
- Improved Simultaneous analysis of multiple live signals
- M/S and L/R dual curve mode
- Live display of the difference between two curves
Metering, Correlation & Stereo Image
- Precise metering (peak, hold, EBU, LRA, RMS)
- Improved LUFS metering with all relevant values visible simultaneously
- Innovative 31-band frequency correlation meter
- Goniometer and correlation meter
- New Pan in correlation meter
Display & Interface
- Improved Better overview when overlaying multiple curves
- New Fullscreen mode
- New Freely adjustable font size
- Resizable plugin window
- New Rainbow mode for color gradient in frequency curve
References & Presets
- Improved Even more reference curves for different music styles
- Improved Improved snapshot and reference management
- New Full-text search in references and presets
- All reference curves available as mid, side, left, and right signals
- Create your own reference curves
- Improved Drag-&-drop analysis of .wav, .aif, .mp3, .flac, .ogg directly from Explorer or Finder
- Direct drag-&-drop analysis from Cubase, Nuendo, and Logic
Operation & Workflow
- New Restore deleted curves
- New Zoom via shortcuts and mouse wheel
- Improved Redesigned operating concept
- Improved Create screenshots of individual or all modules
- New Save screenshots directly to clipboard
- Manage multiple instances in one display (e.g., drums/bass/guitar/vocal)
- Improved Optional auto-clear on playback start
- New Optional auto-snapshot function after offline render
Integration & Technology
- Improved HOFA Analyzer V3 measurement points can be transferred to HOFA EQs
- New Automatically adopt track color from DAW (in almost all common DAWs)
- Use host track names (in almost all common DAWs)
- Supports all common sample rates and operates latency-free
Formats: VST3, AU, AAX
Operating System: macOS 10.13 or later, Windows 10 or later
HOFA plugins are continuously tested on the following DAWs:
Ableton Live, Apple Logic, Avid Pro Tools, Bitwig, Cockos Reaper, Image Line FL Studio, Magix Samplitude/Sequoia, Fender Studio Pro, Steinberg Cubase/Nuendo/Wavelab
You have two licenses available. These are managed via the HOFA Plugins Manager, where they can also be deactivated and transferred to other computers.
It is also possible to activate and use HOFA plugins offline. Licenses on USB sticks can be used alongside USB licenses from other plugin manufacturers without any issues.
You will find helpful answers to many questions in our support center:
You can also reach us on weekdays at plugins@hofa.de and +49 7251 3472-444